You can't manage what you can't measure

Peter Drucker

penNO helps you track expenses and income, split costs with anyone, and truly understand where your money goes.

Penno Dashboard

The story of Penno

Hi, my name is Michele. I'm a product manager, but I've always loved programming.

I built Penno for myself. I wanted a simple tool to understand where my money was going and split expenses clearly with the people close to me.

After months of daily use, I realized it could be useful to others too. So I decided to share it.

Penno penNO

The name penNO plays on two meanings: 'no pen' — no paper and pen, everything digital — and 'penny', because every cent counts.

Penno isn't meant to replace your bank. It's meant to give you awareness: knowing how much you spend, how much you save, and where you can improve.

A real-world example

How Michele and Federica use Penno every day
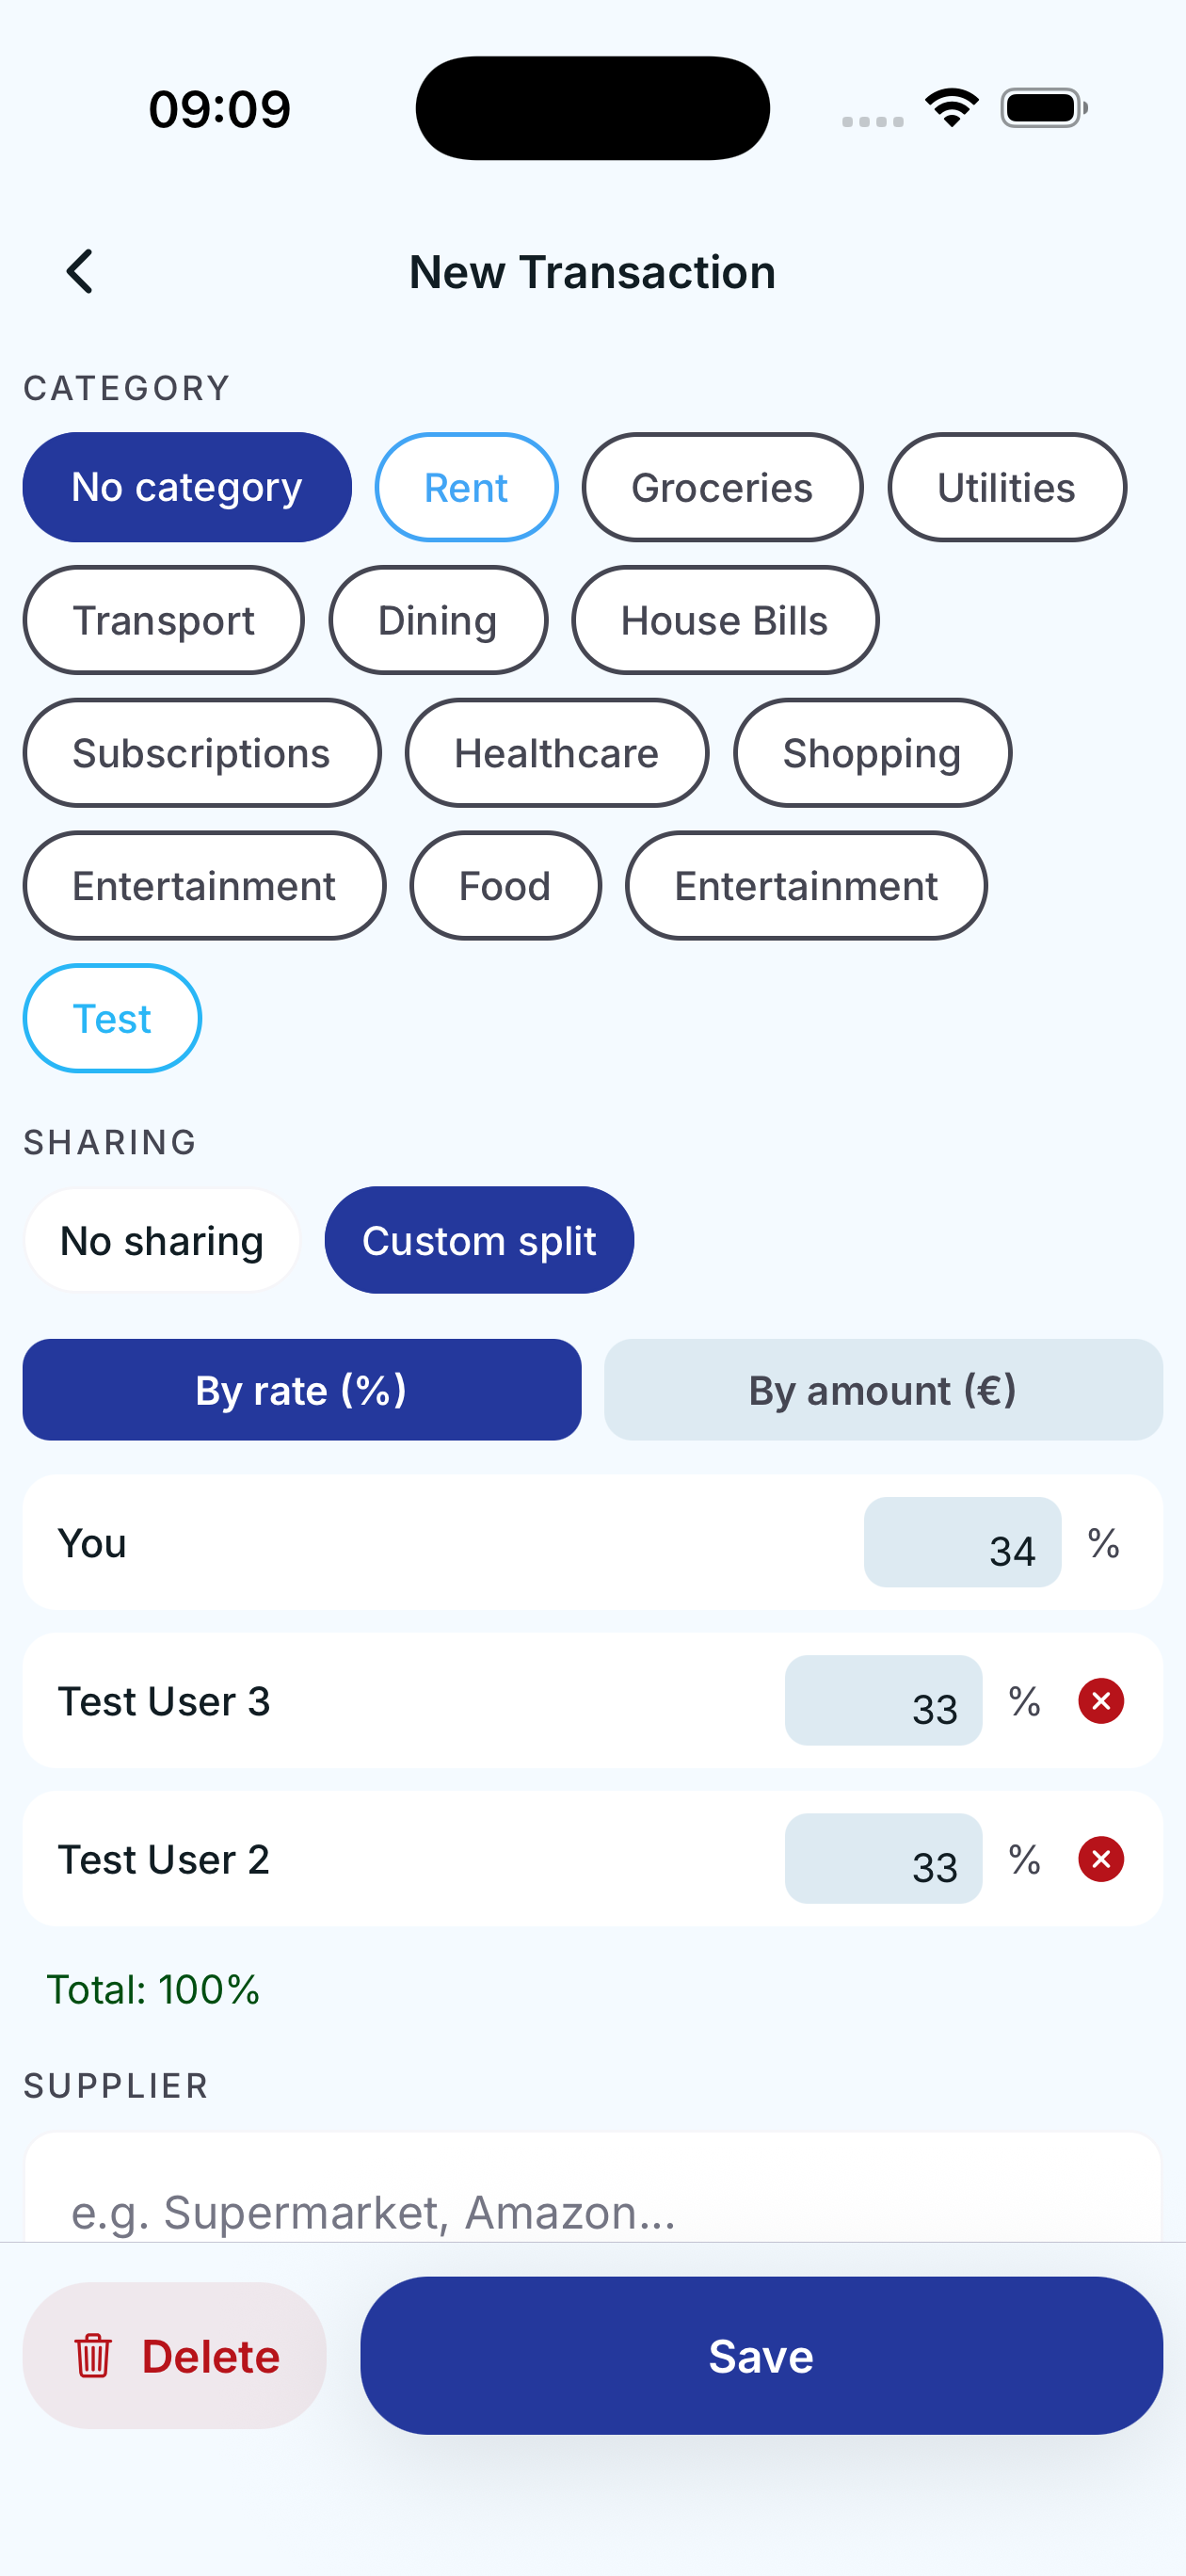
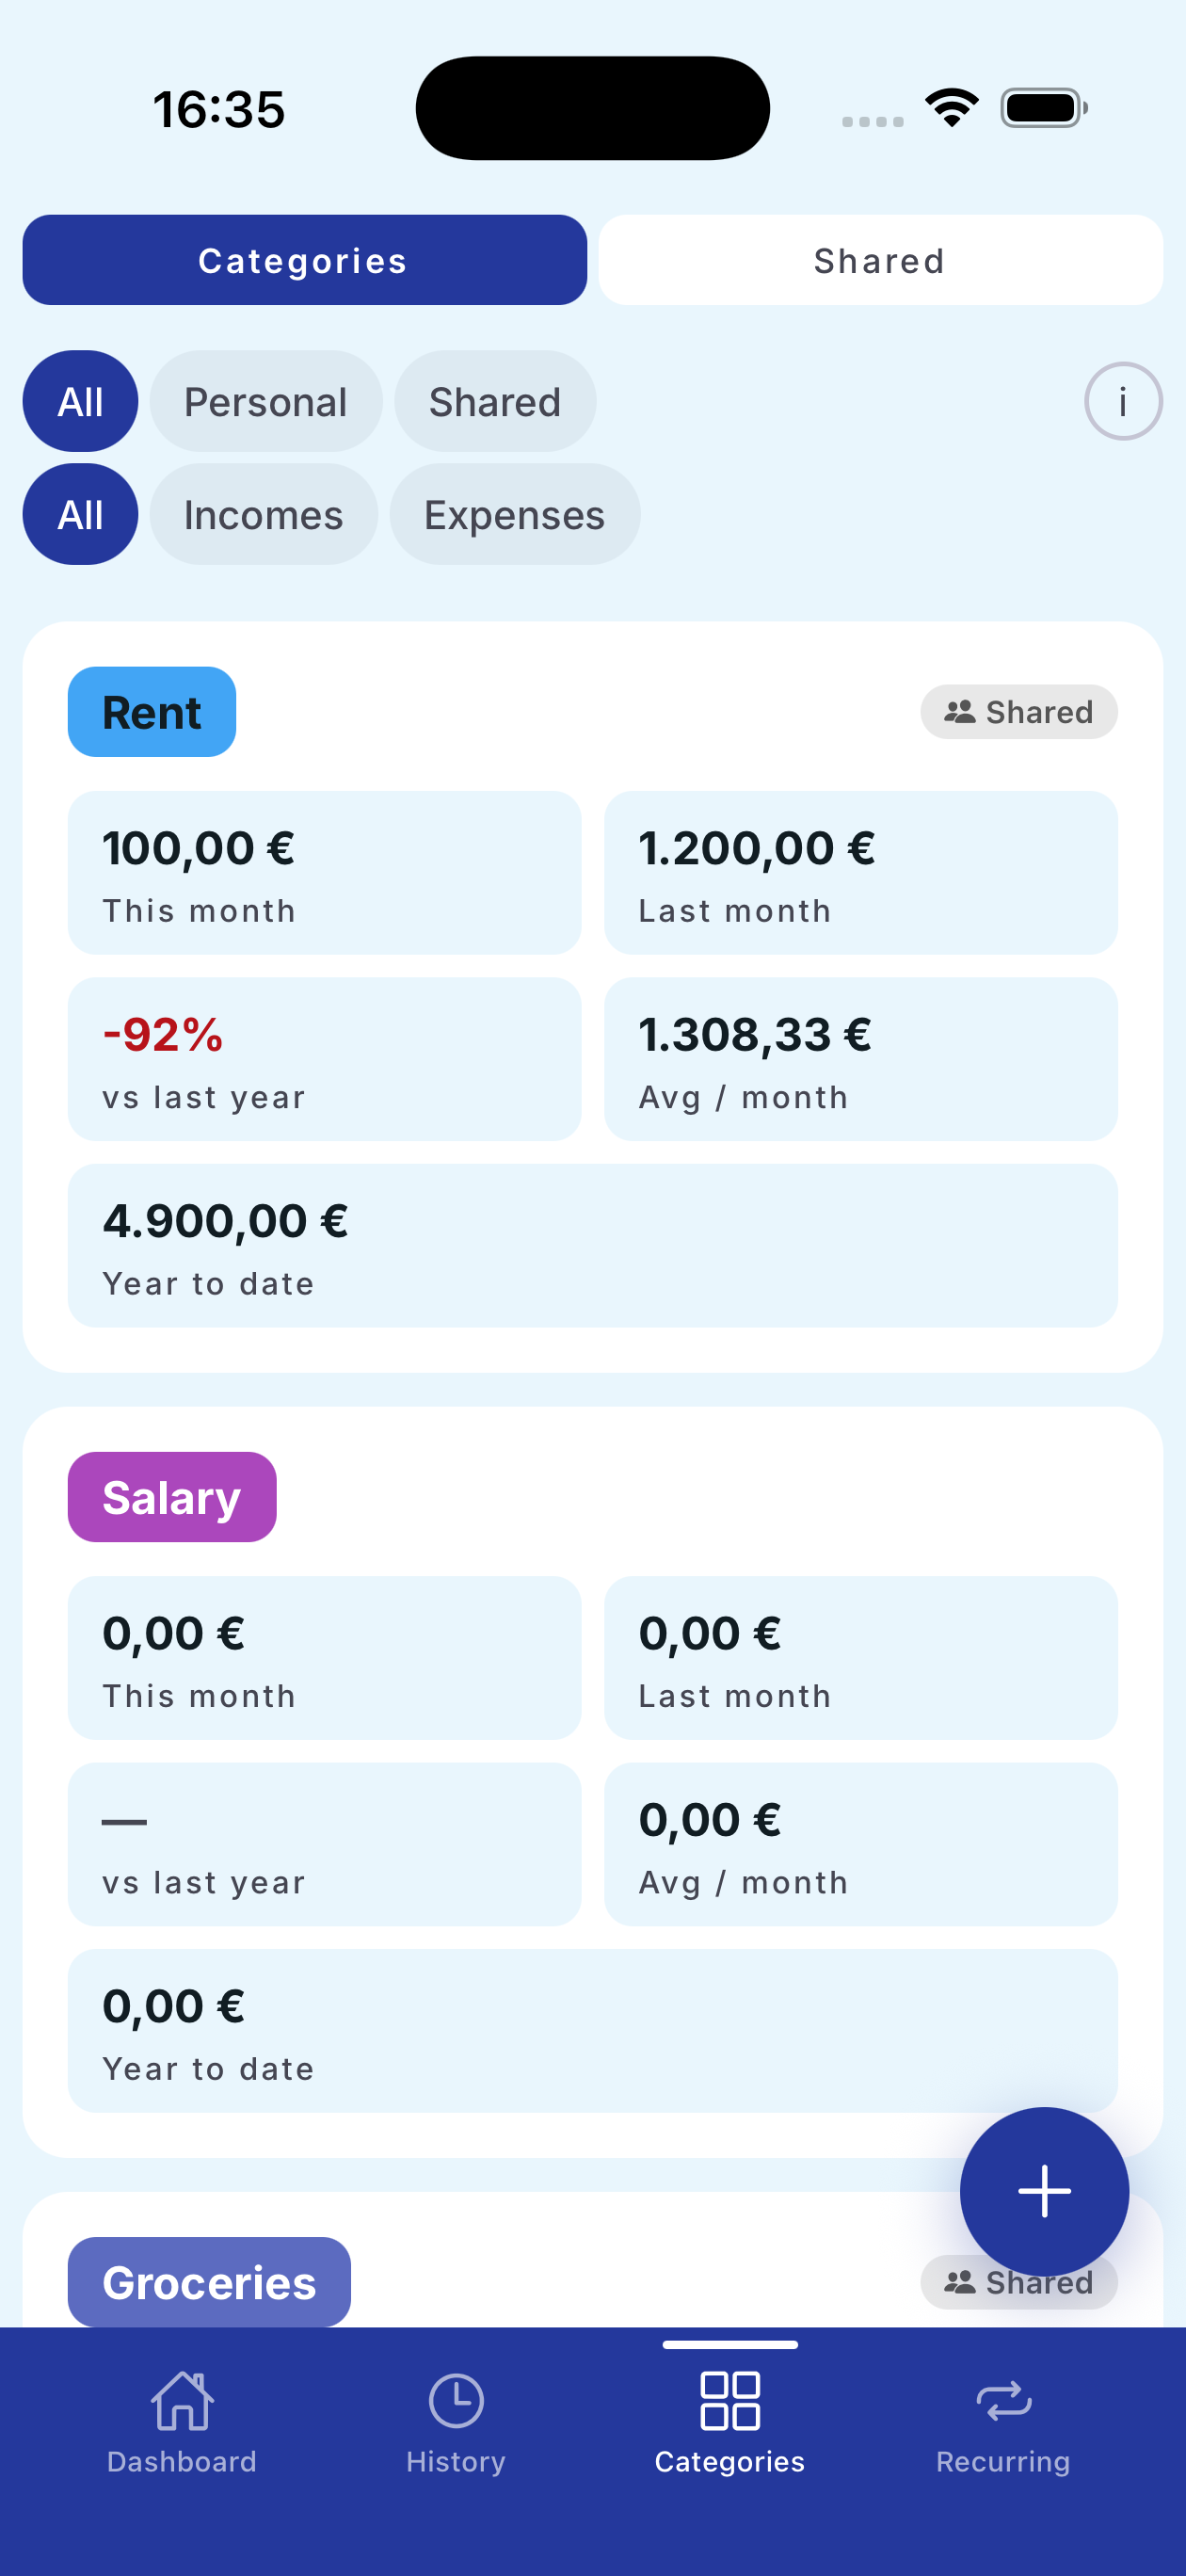
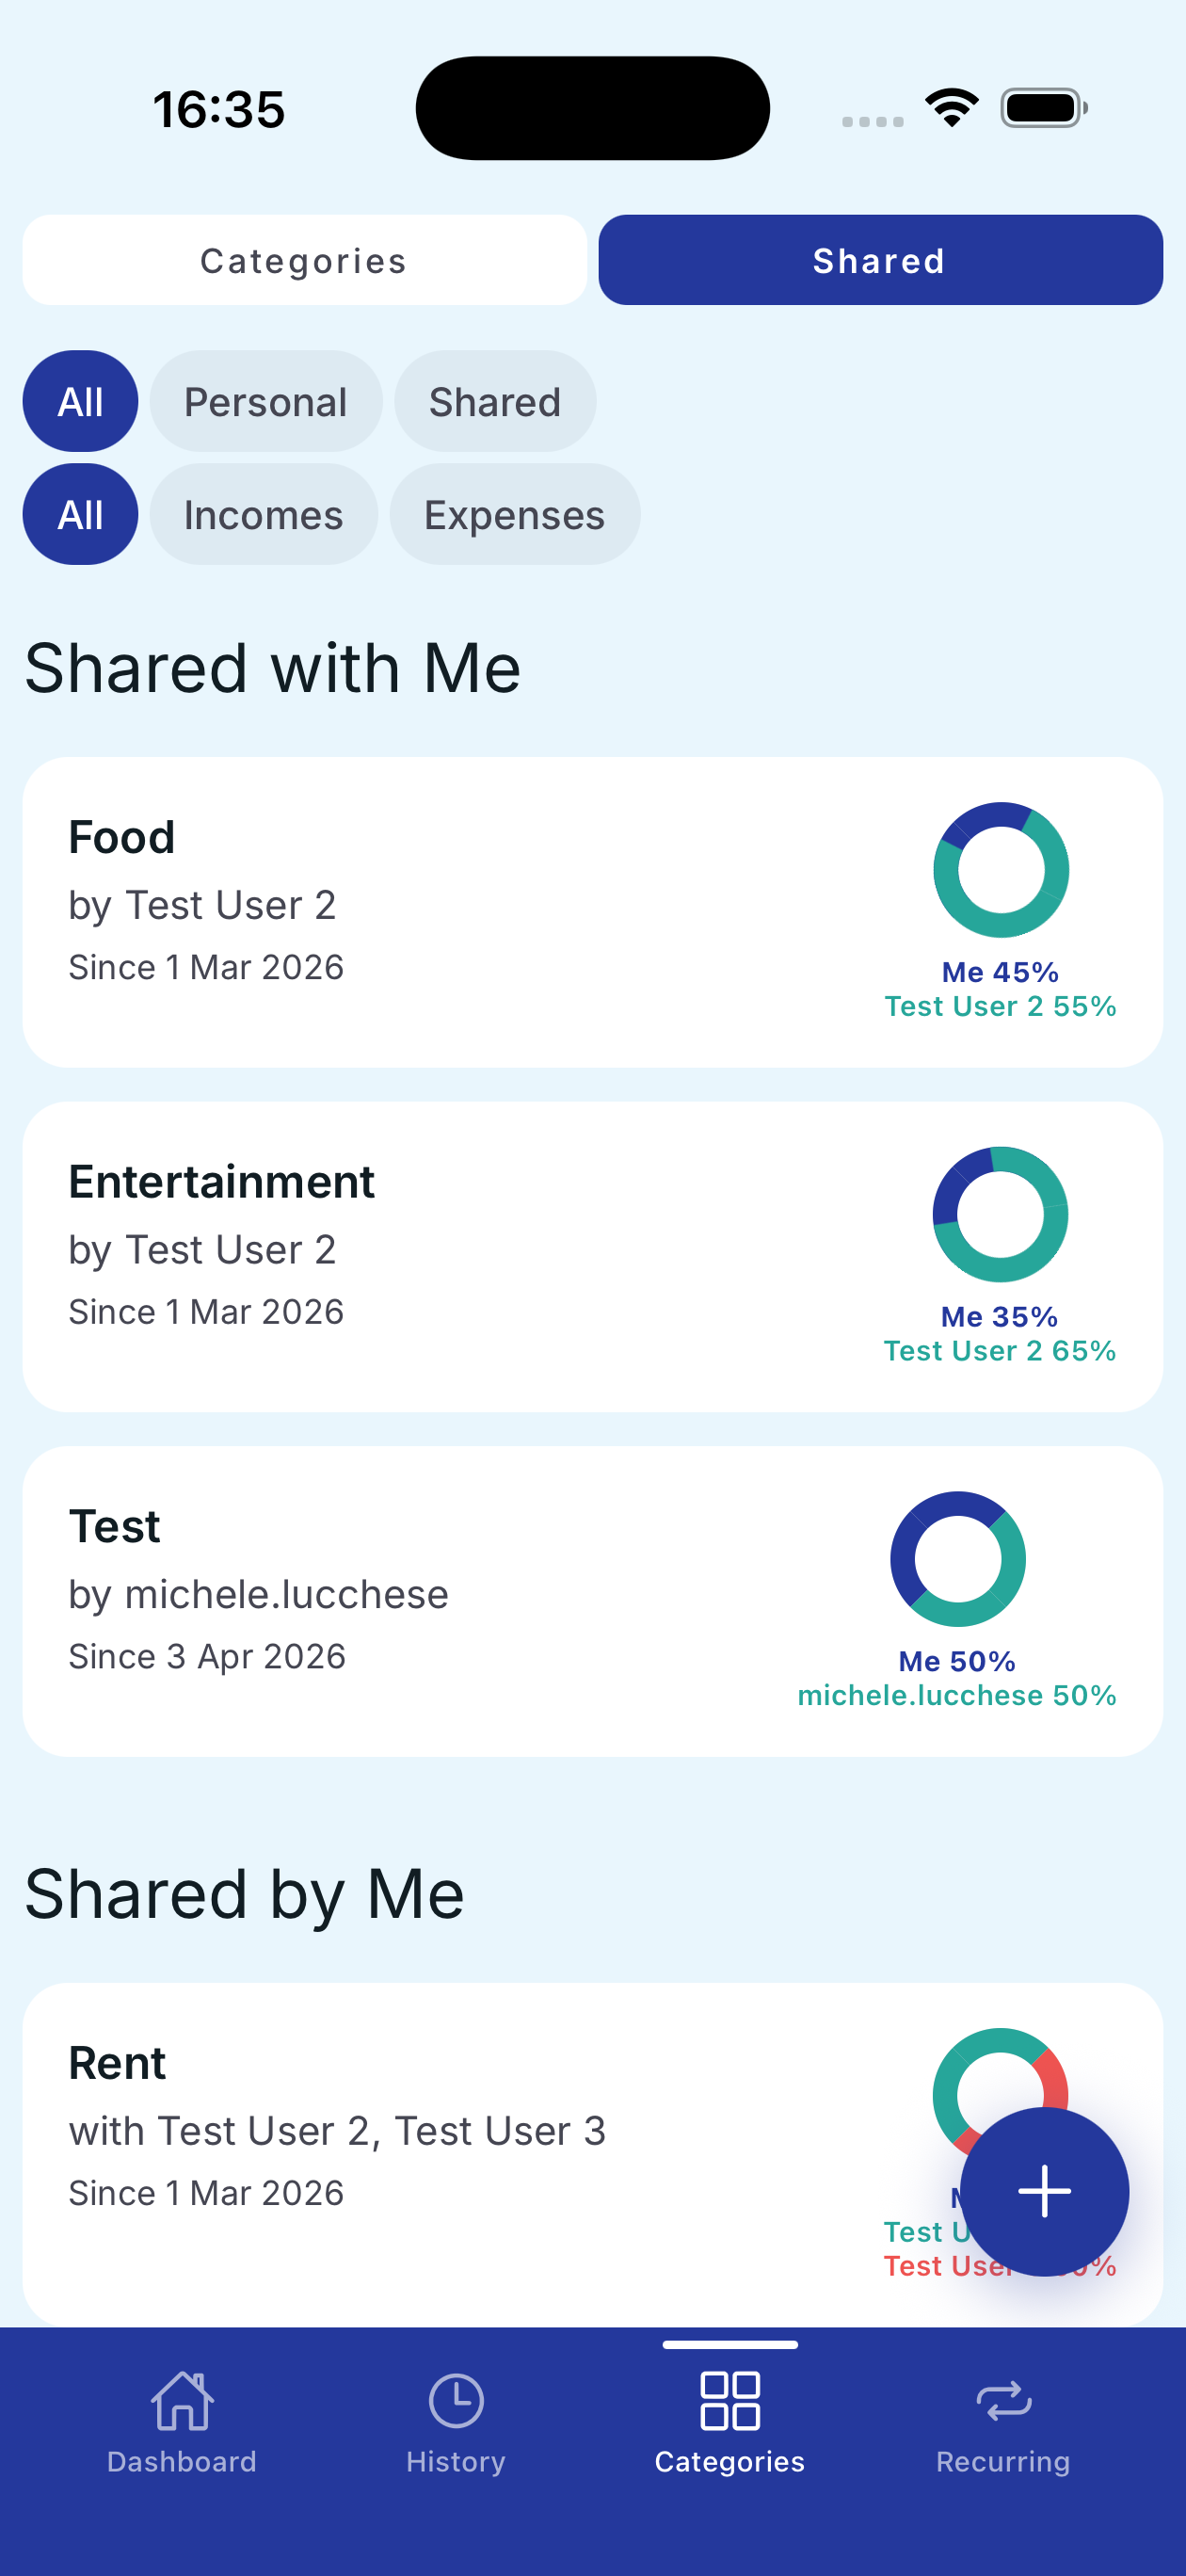
1

Shared categories

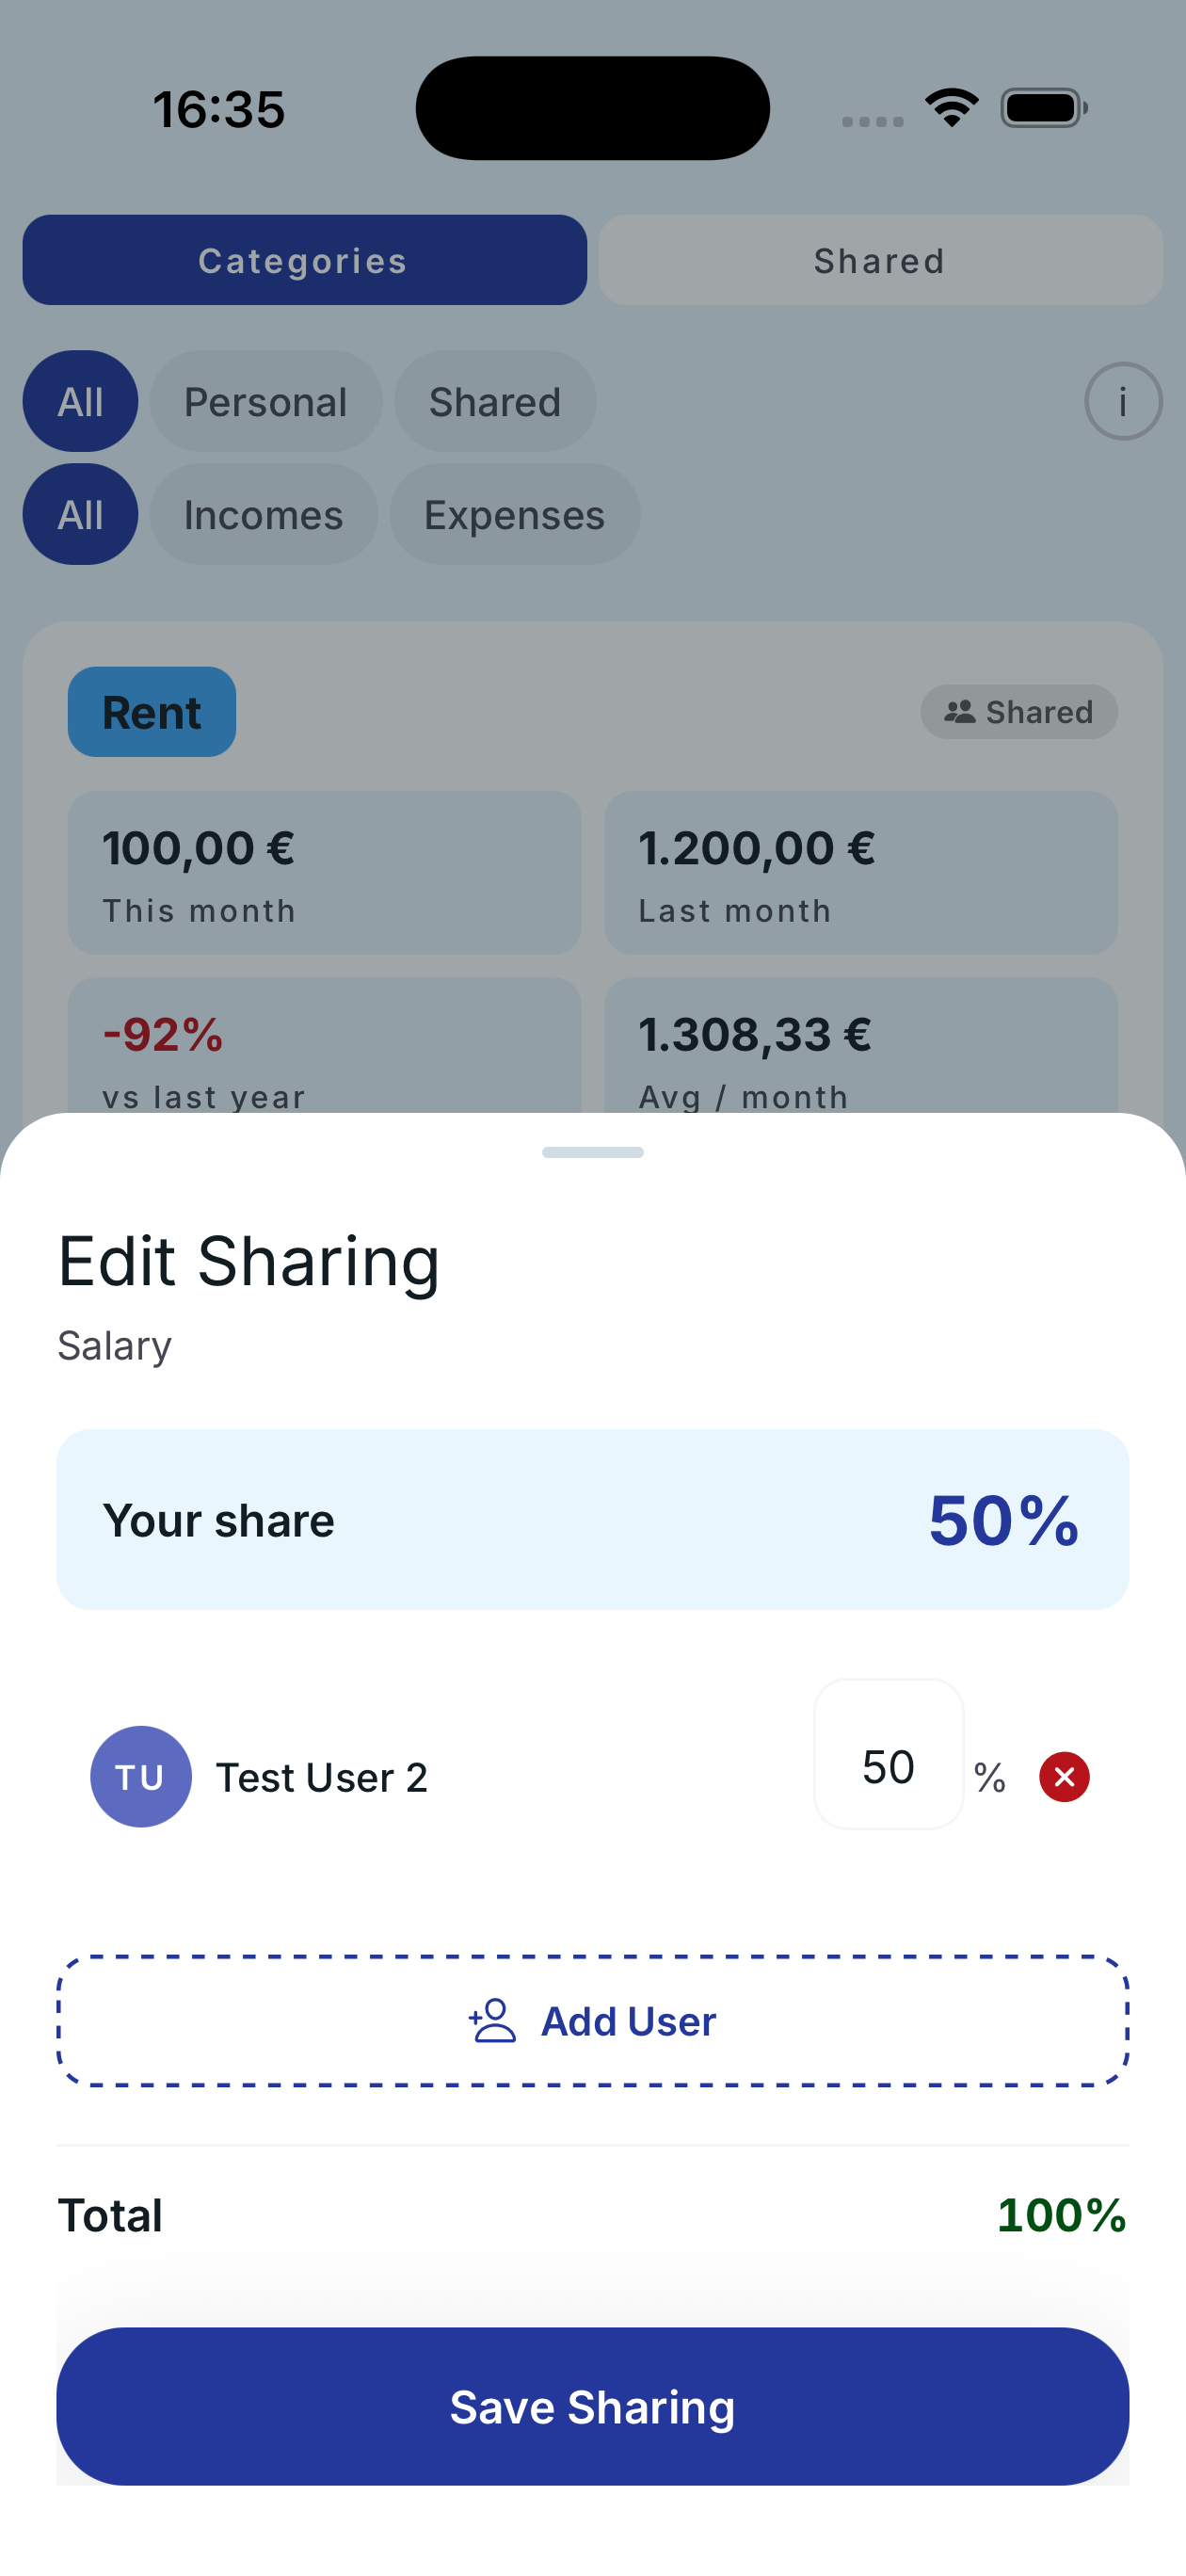
Michele and Federica live together. They share the Rent, Groceries, and Bills categories on Penno, each with their own percentage.
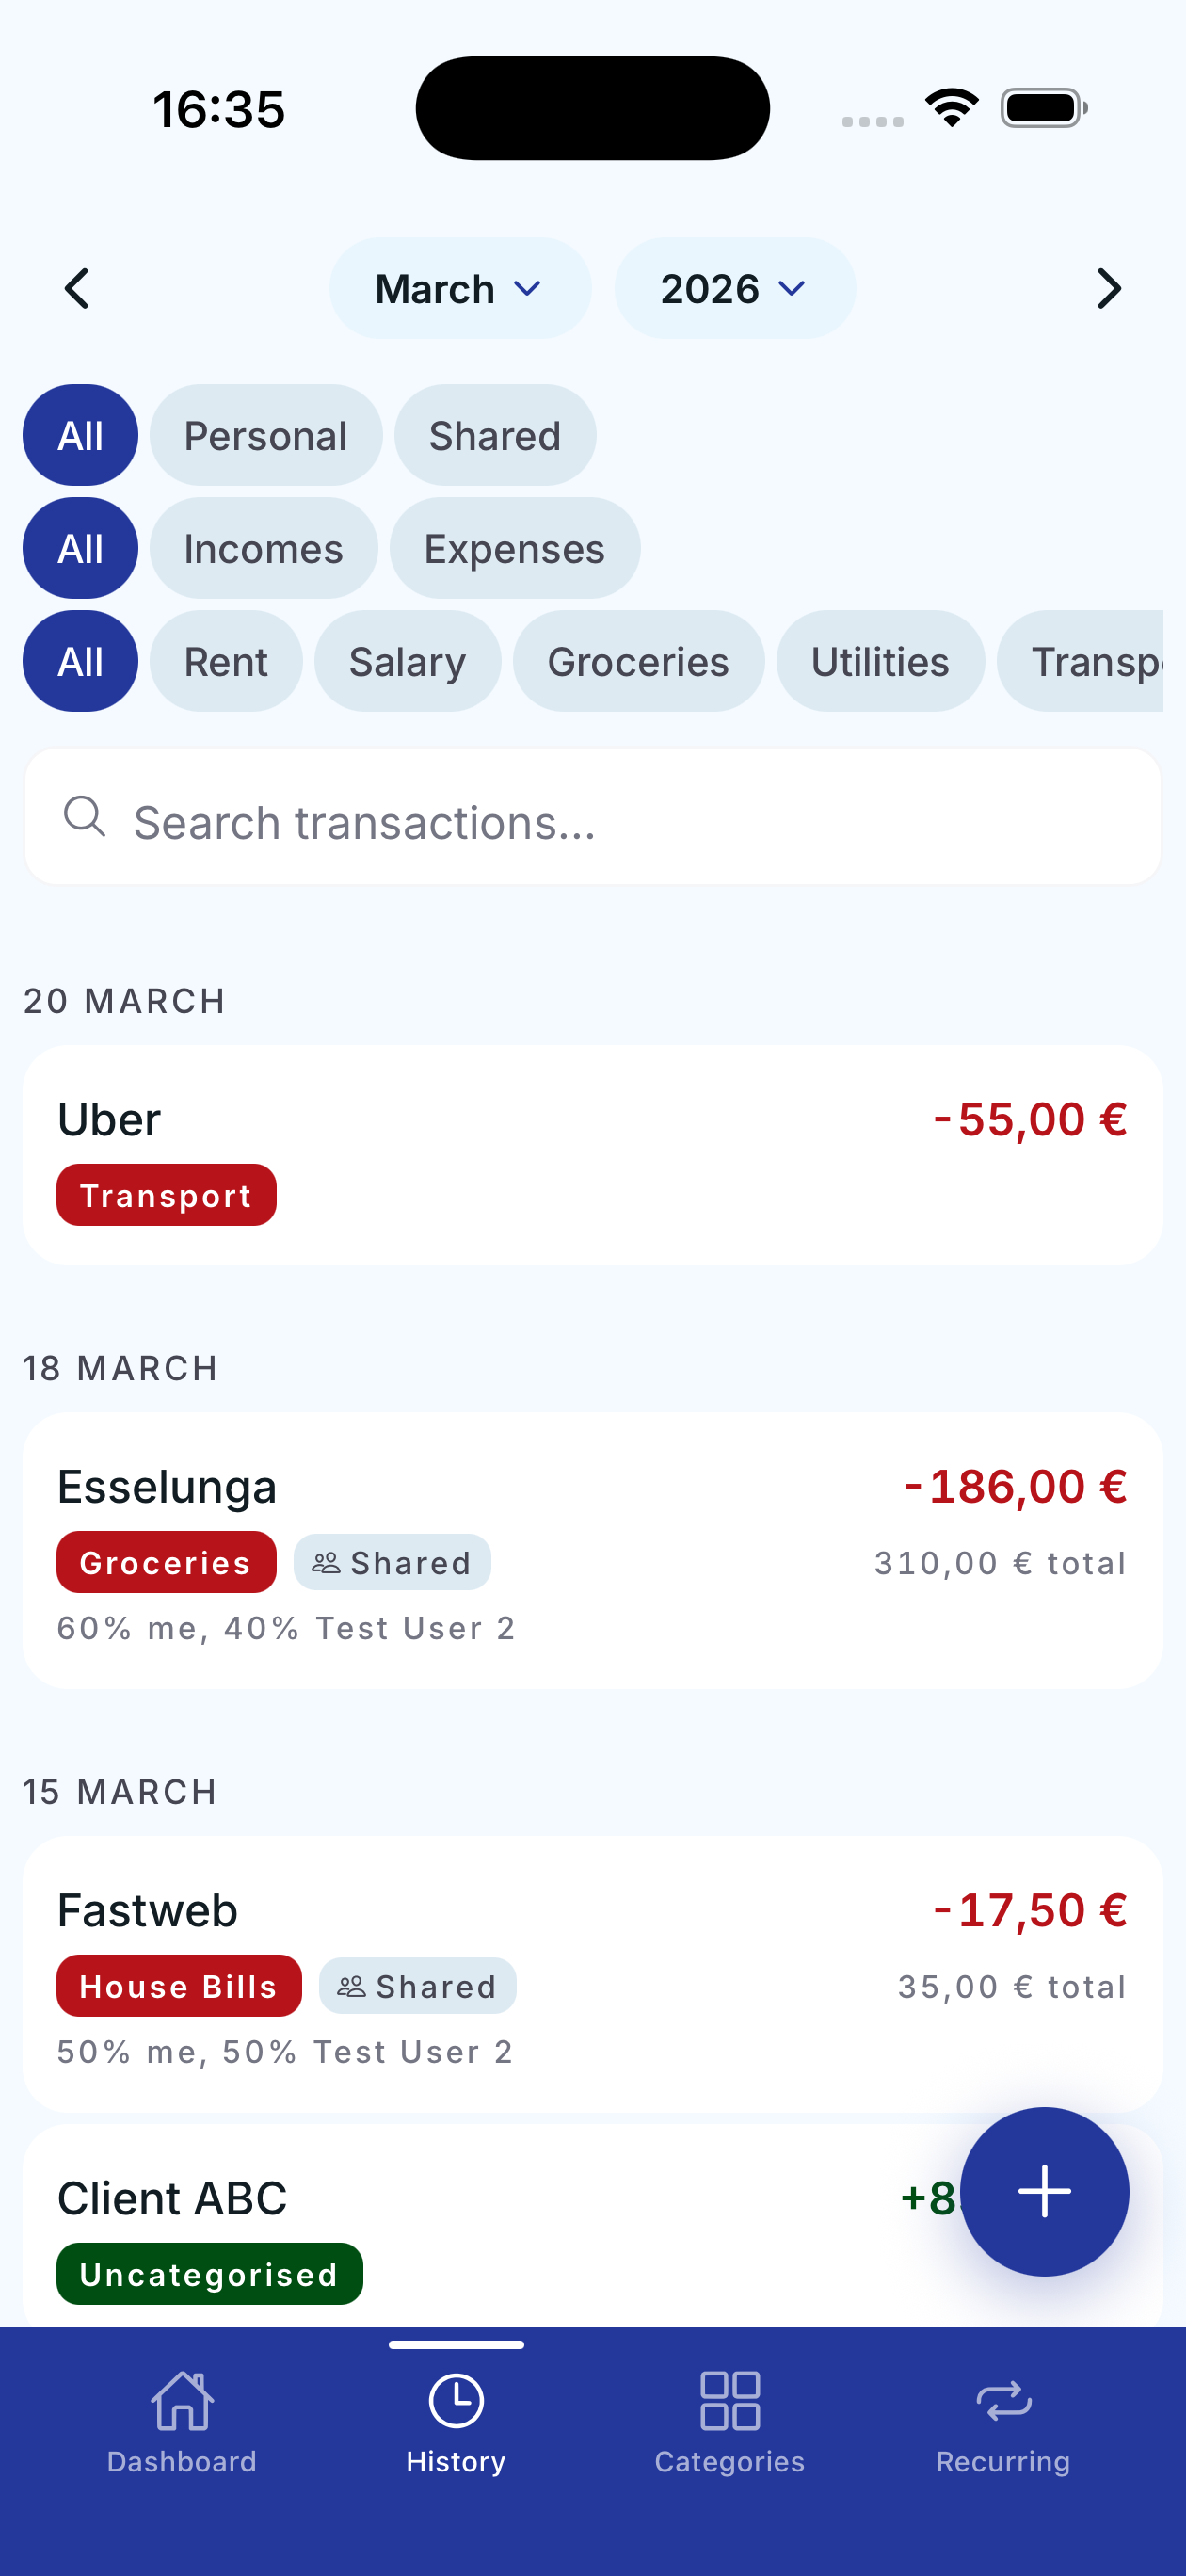
2

Everyday expenses

When Federica buys groceries, she logs the transaction on Penno. The app automatically calculates Michele's share based on the configured percentage.

3

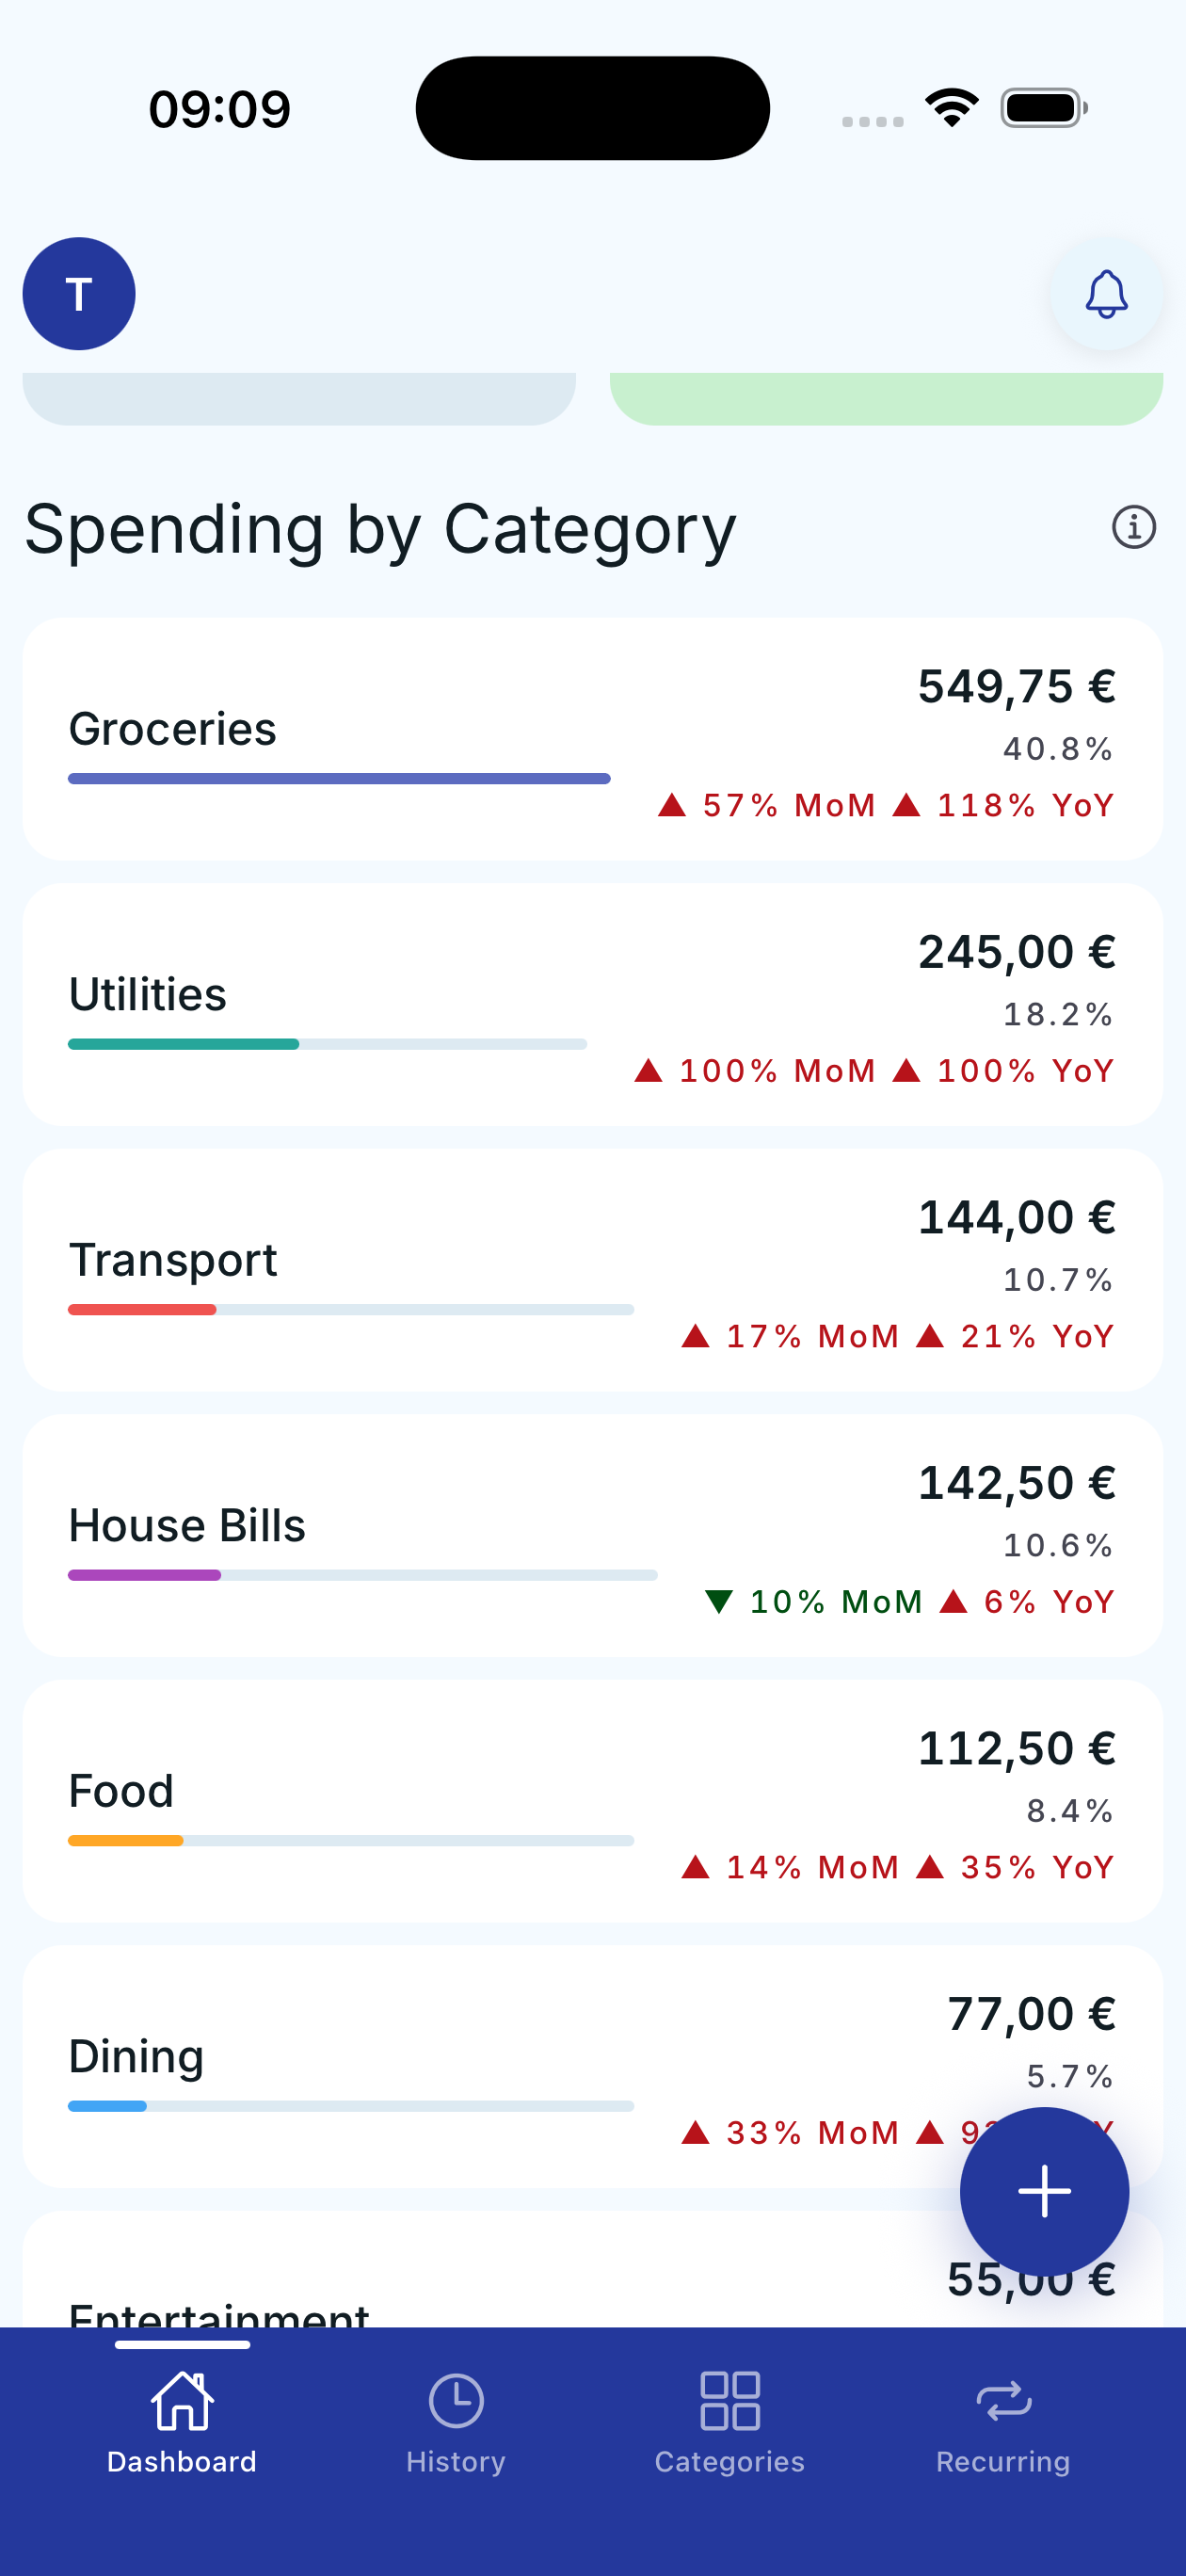
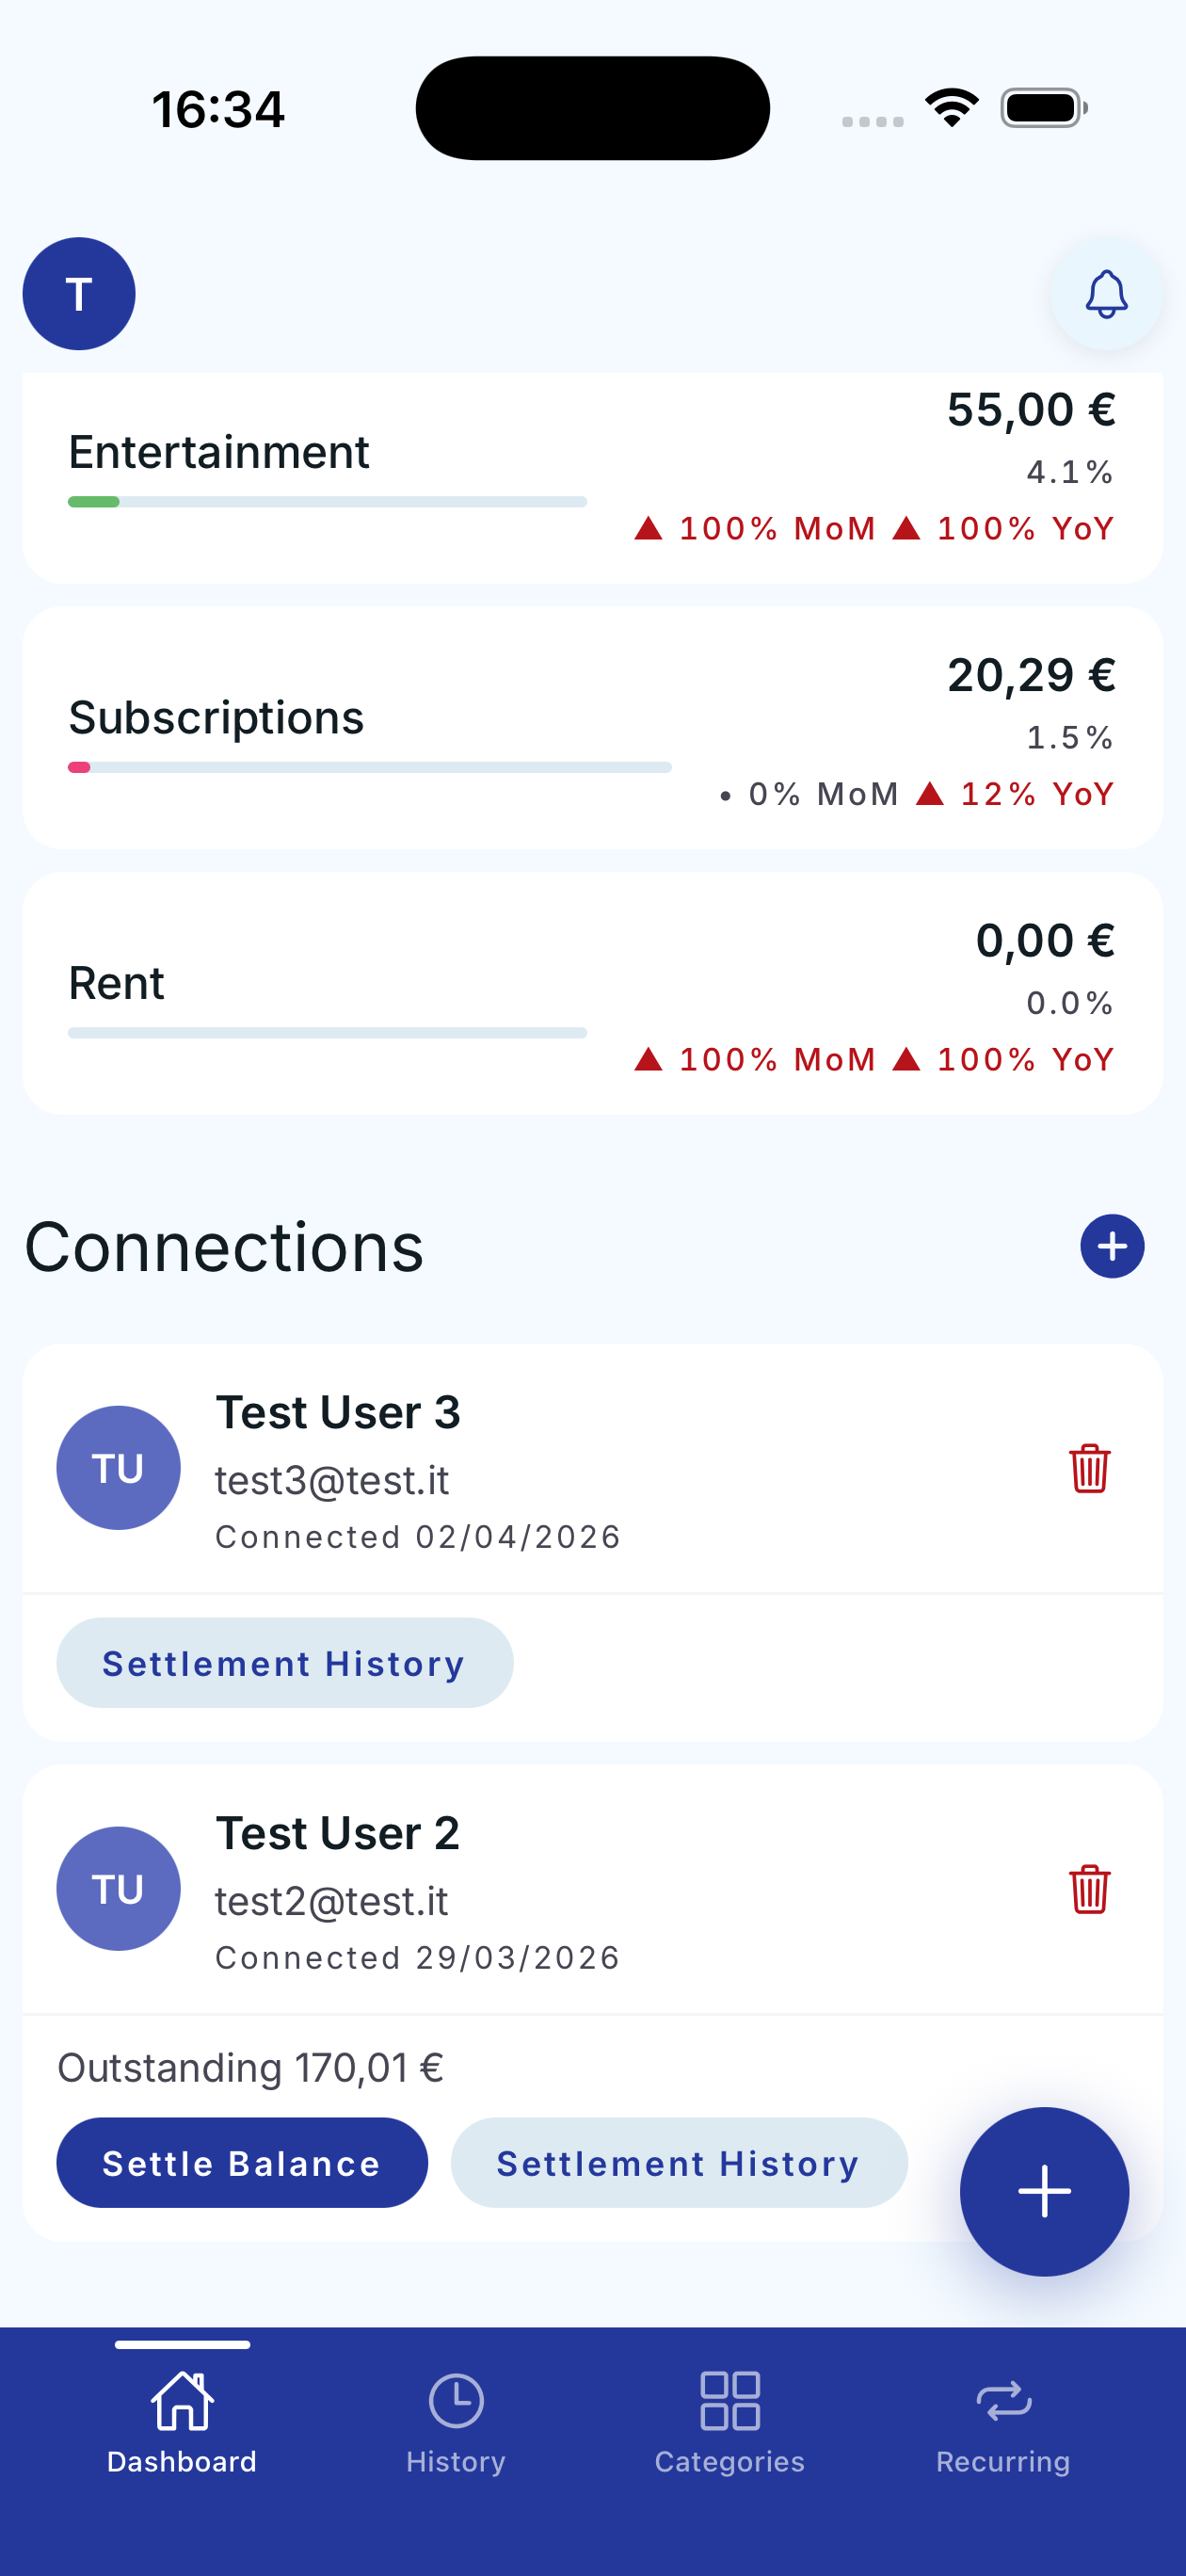
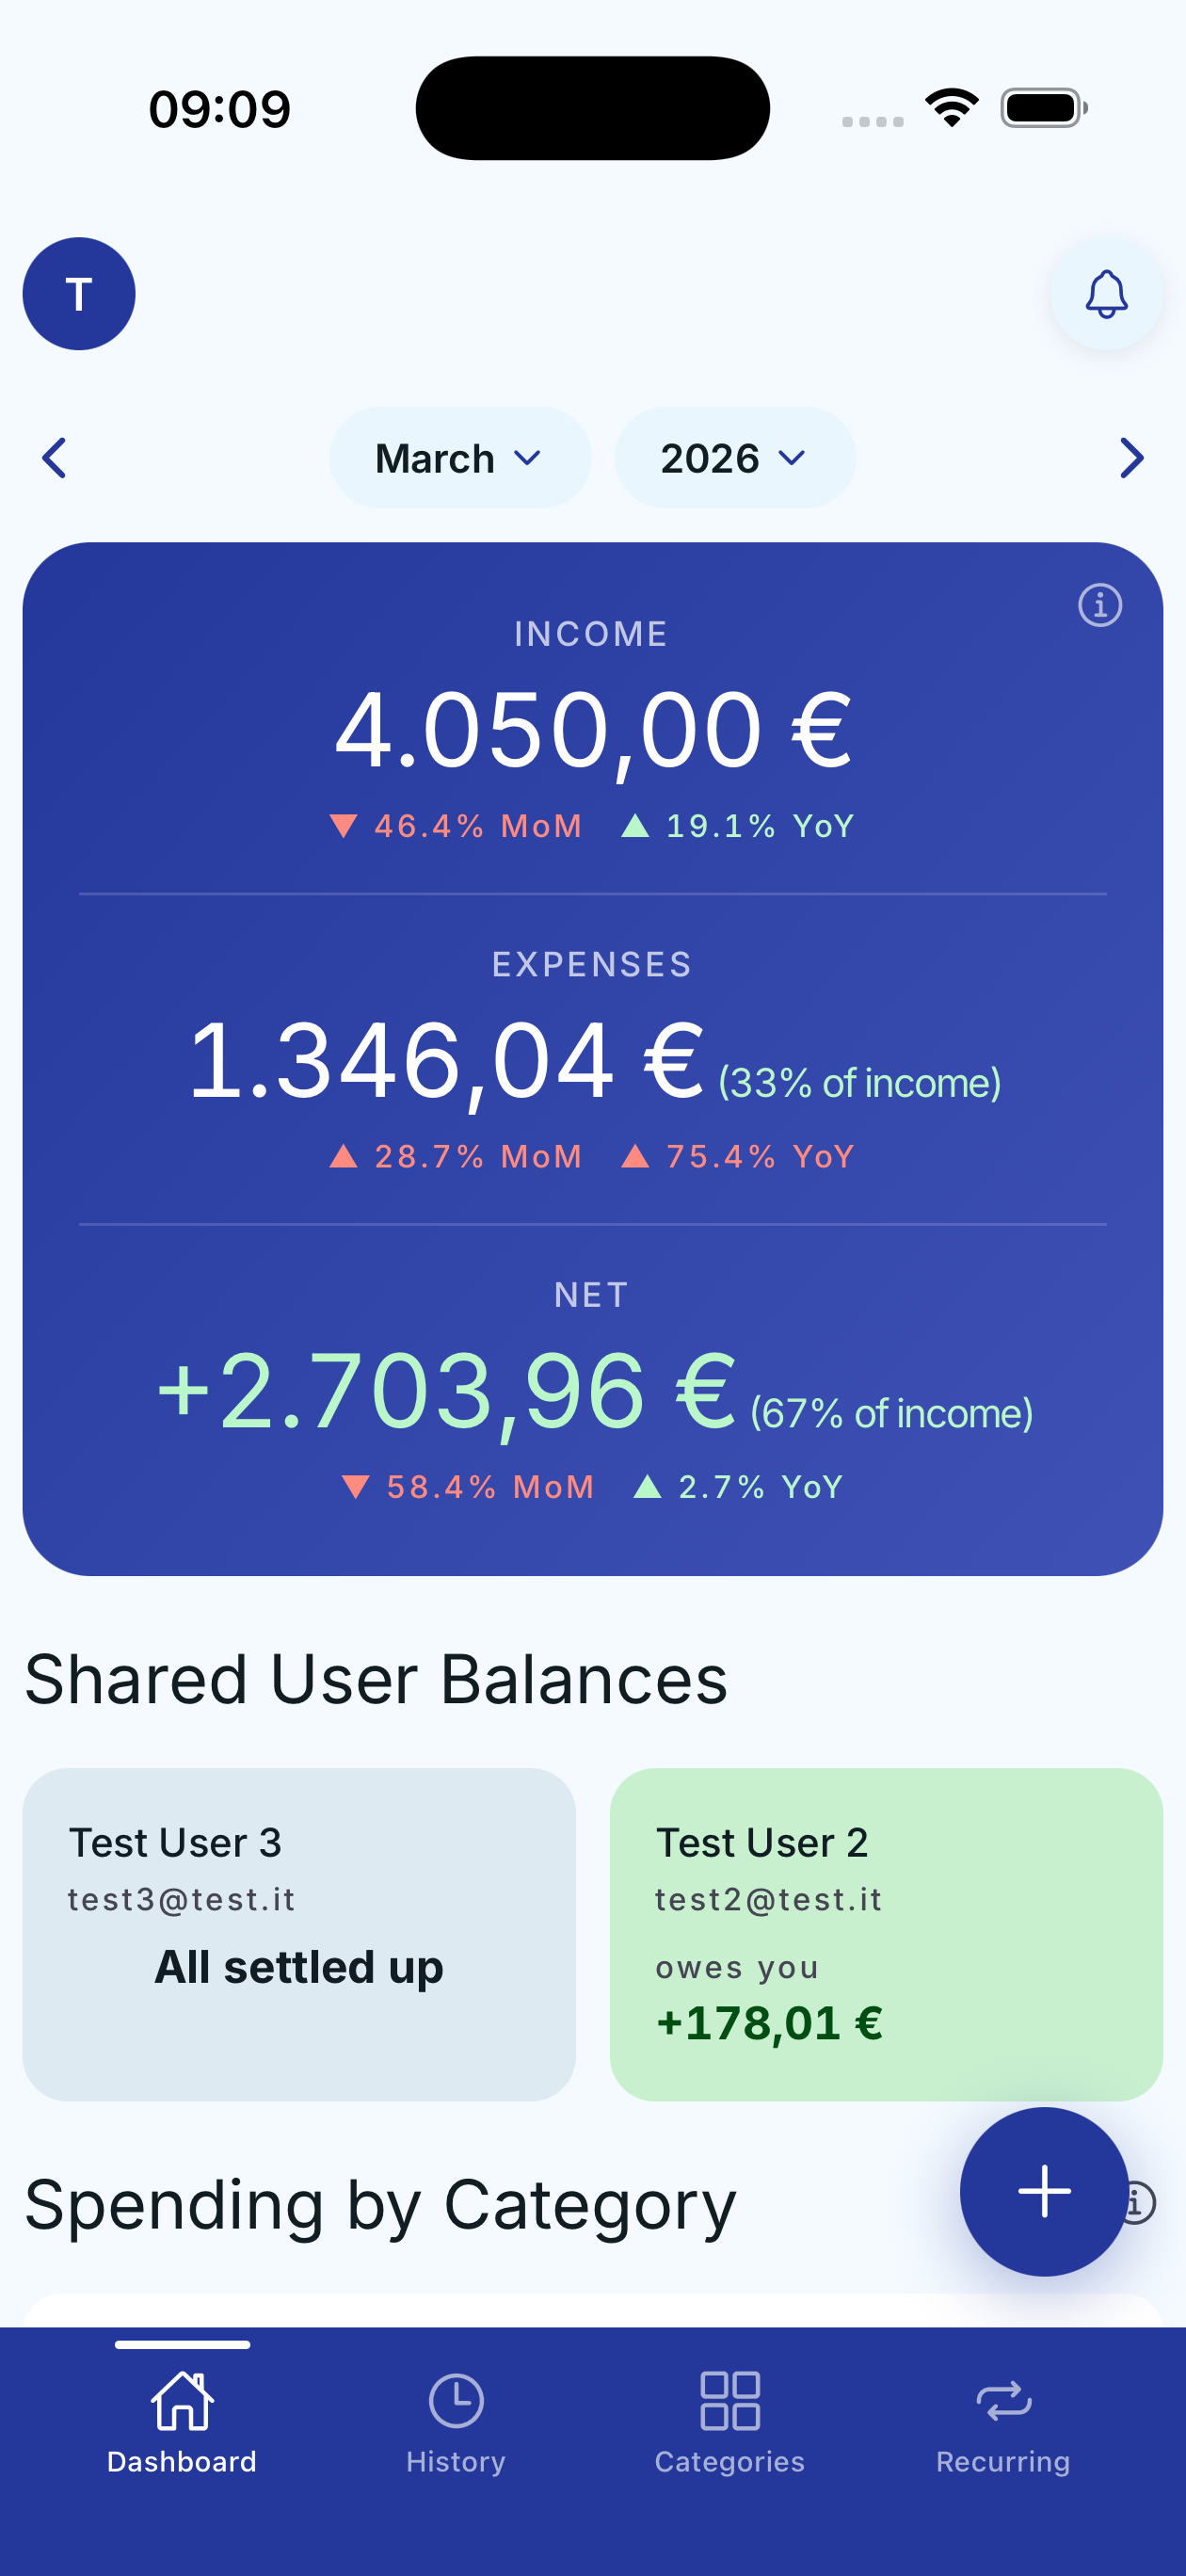
Always up-to-date balance

On the dashboard, both can see in real time who owes what. No more spreadsheets or end-of-month arguments.
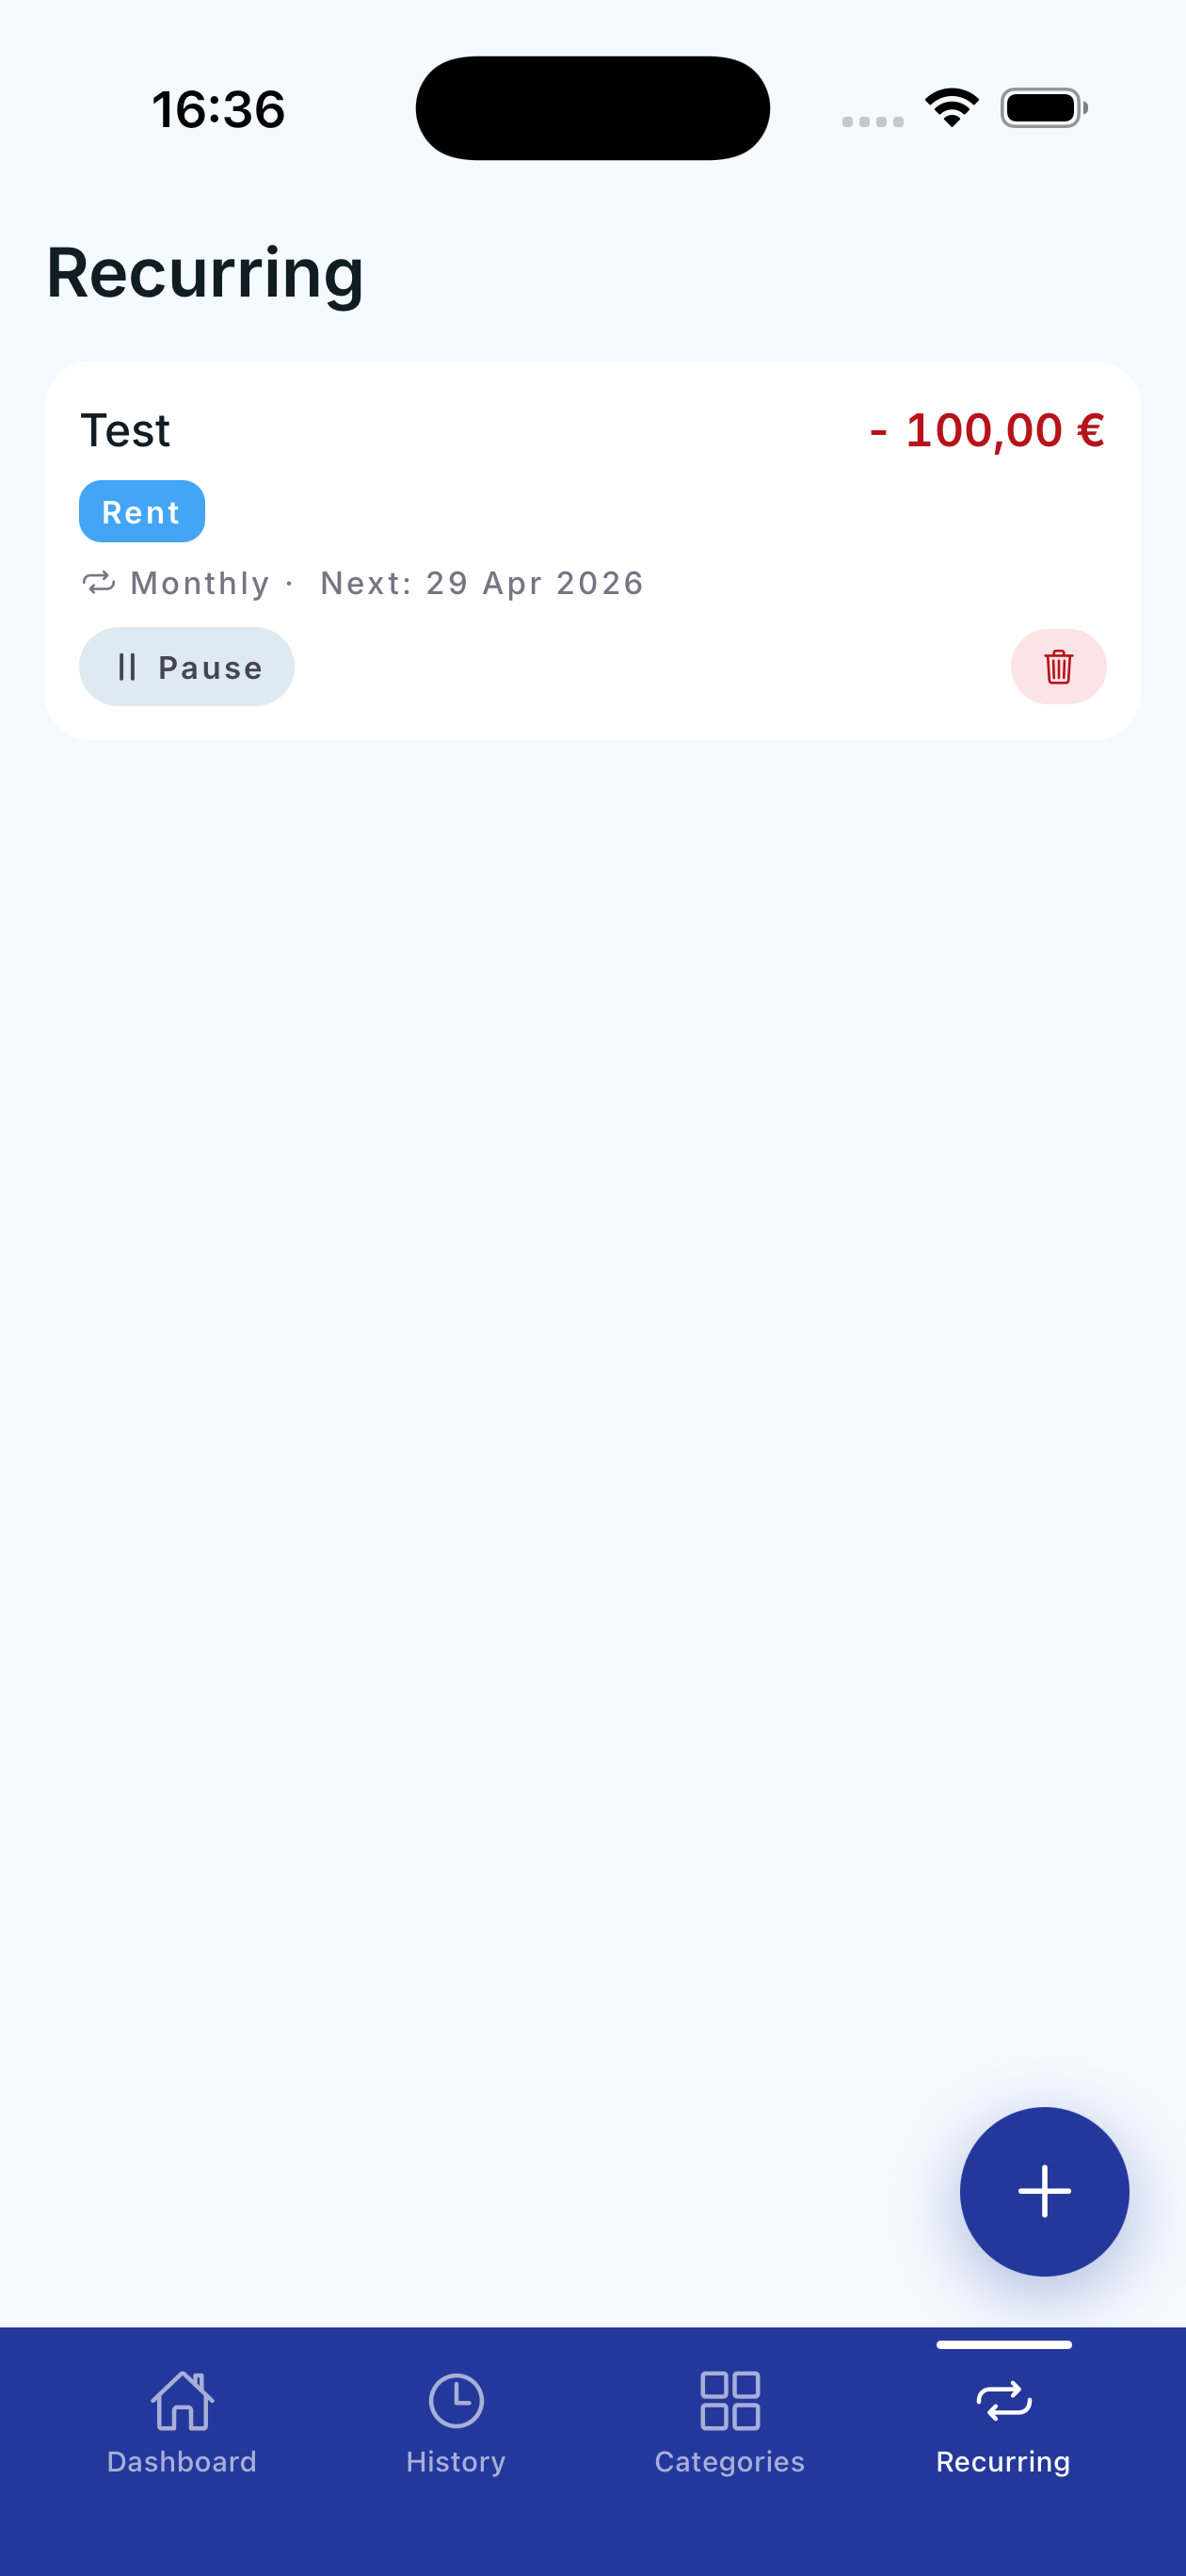
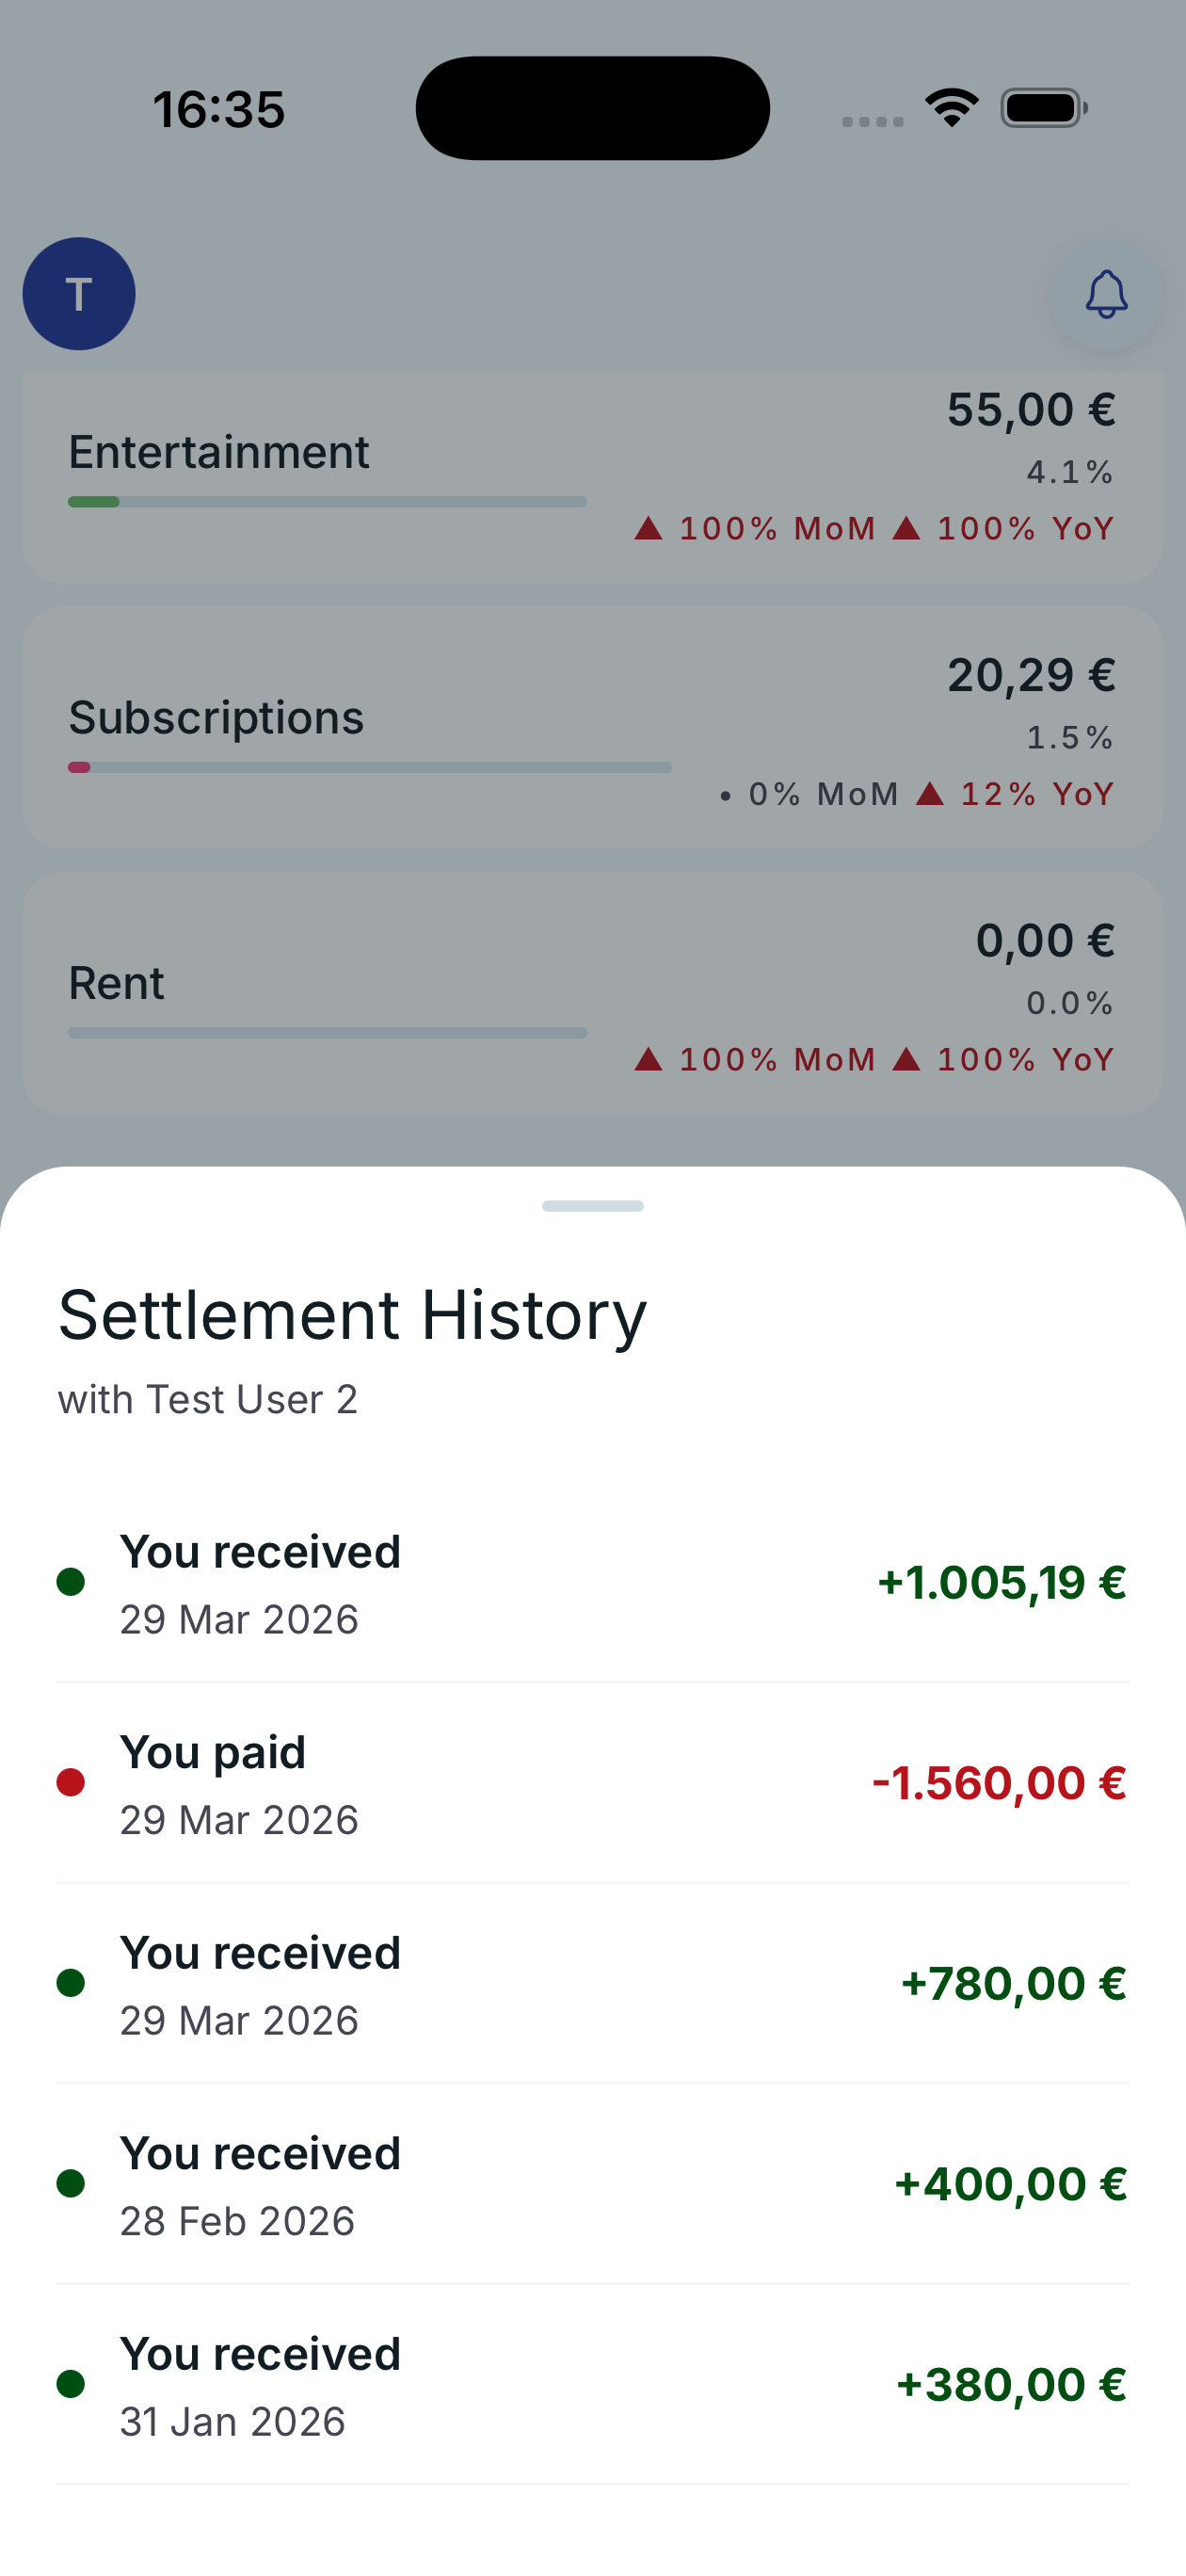
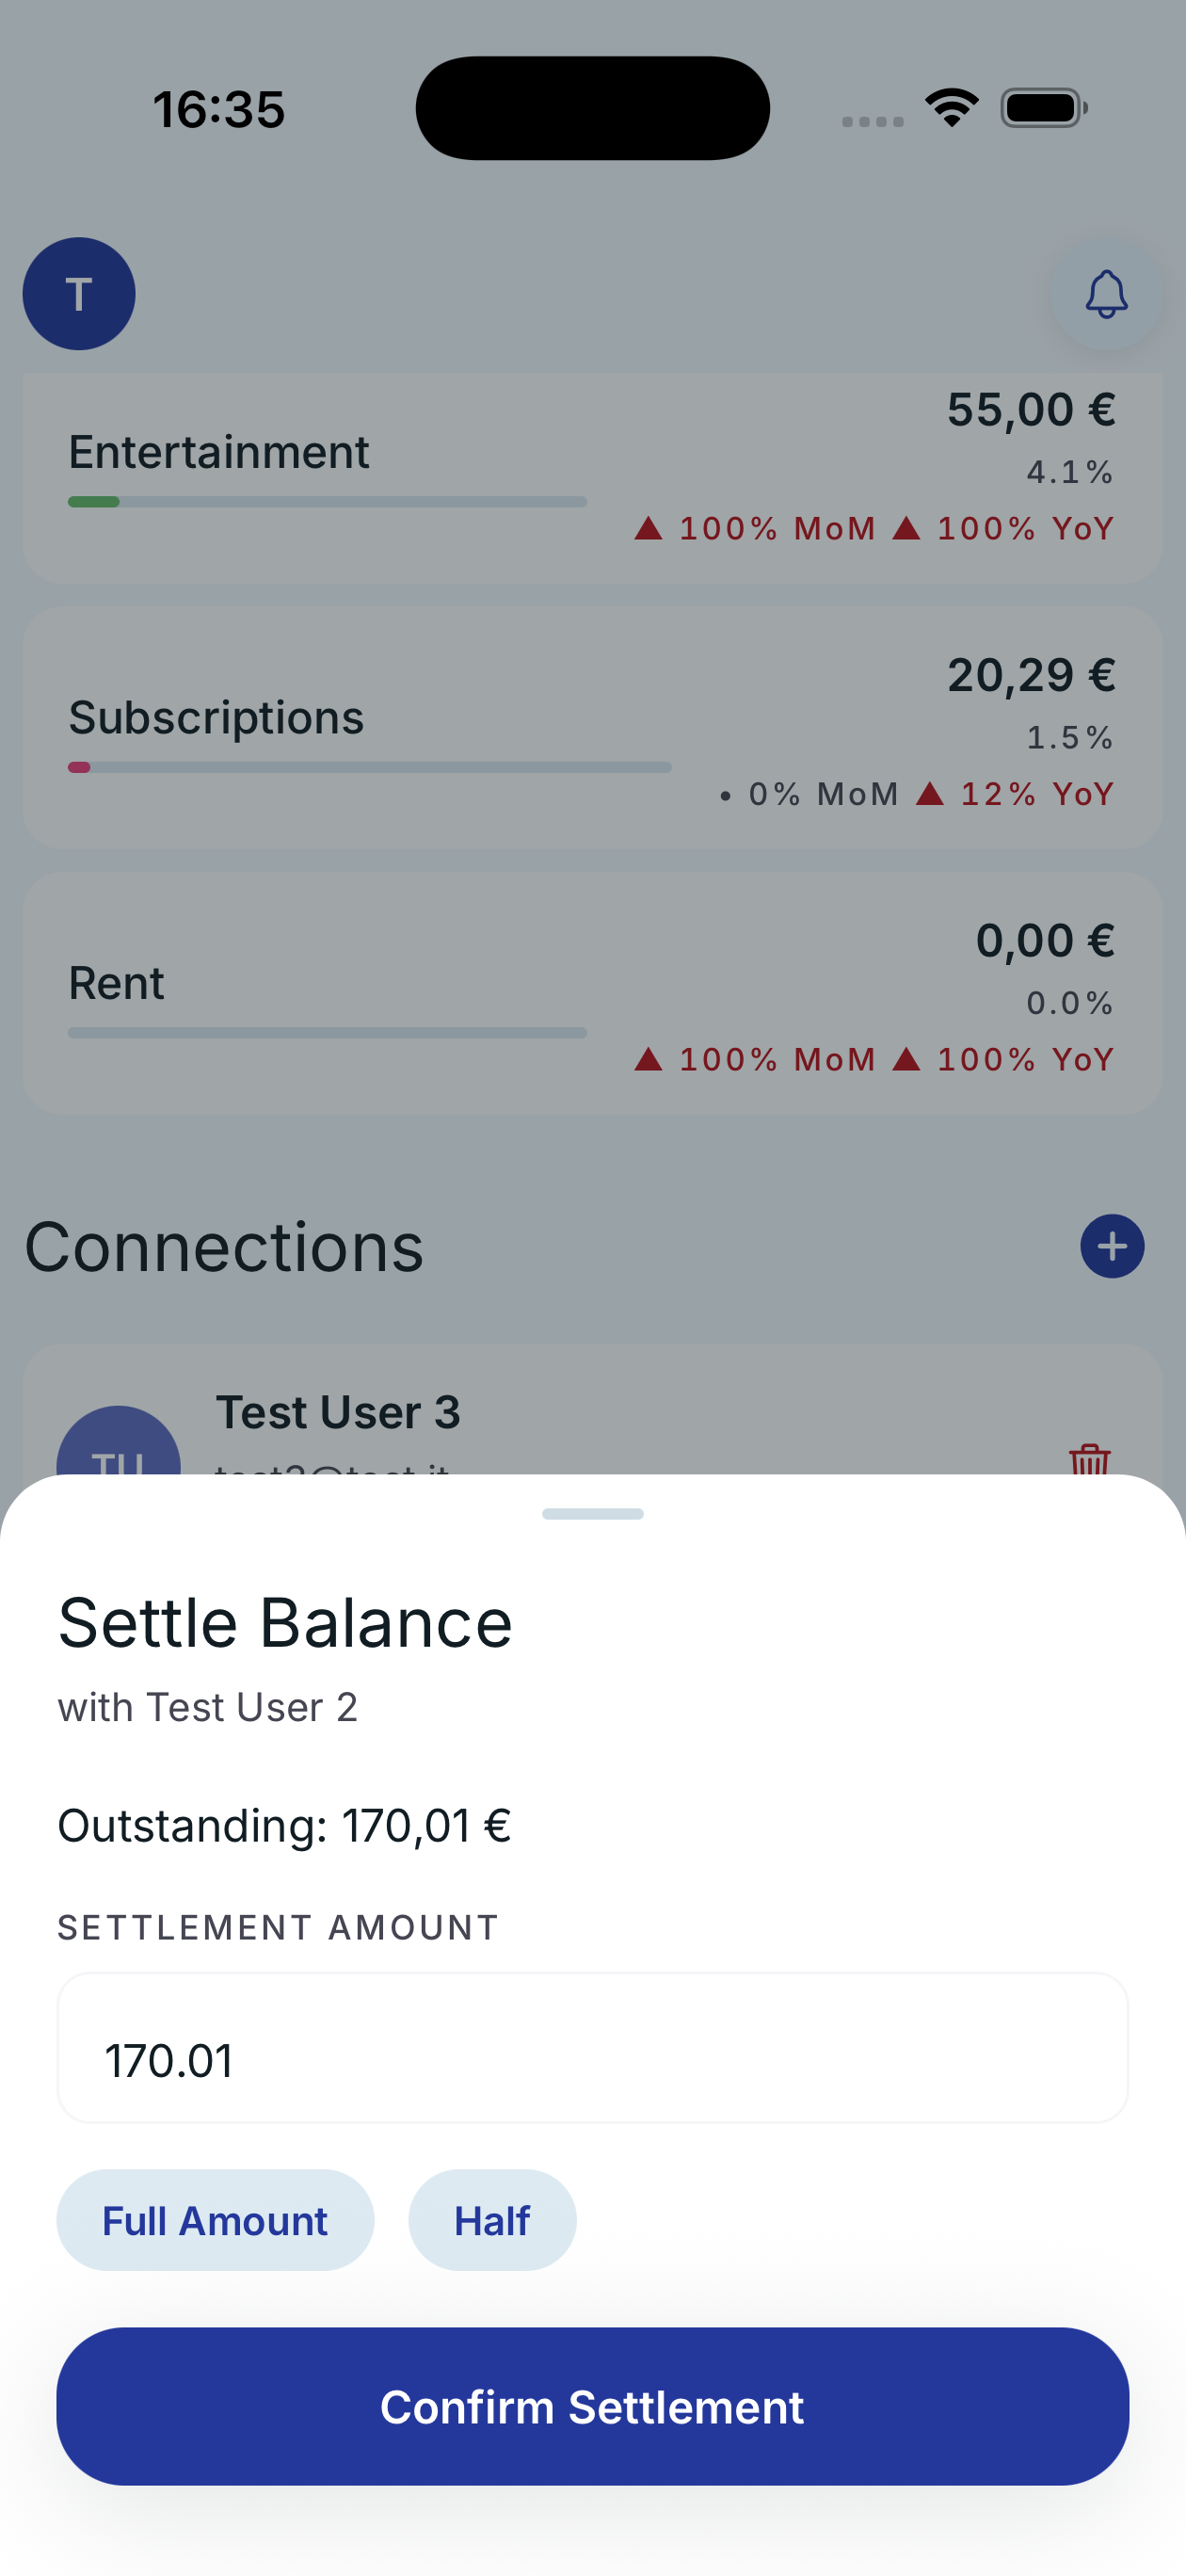
4

Settling up

When the balance reaches a certain amount, whoever owes sends a bank transfer and logs it as a settlement. Everything tracked, everything transparent.

Penno in action

Explore the app through its screens.

Quick sign in

Quick sign in

Sign in instantly with Google, Apple or email. Secure and fast.

Monthly dashboard

Monthly dashboard

Complete monthly overview: income, expenses and net savings with MoM and YoY comparisons and shared balances.

Spending by category

Spending by category

See your spending breakdown by category with percentages and month-over-month and year-over-year comparisons.

New transaction

New transaction

Log expenses and income by category with custom splitting by percentage or amount.

Transaction history

Transaction history

Filter by type, category and search across all your transactions. See shared expenses and splits.

Category details

Category details

Deep category analysis: monthly spending, averages, year to date and time comparisons.

Shared categories

Shared categories

View categories shared with other users and their respective split percentages.

Edit sharing

Edit sharing

Configure the split percentage for each shared category and add new users.

Recurring transactions

Recurring transactions

Automate repeating expenses: rent, subscriptions, bills. Pause or delete anytime.

Connections & categories

Connections & categories

Manage your connections, check payment history and settle outstanding balances.

Settlement history

Settlement history

Detailed timeline of all payments received and sent with connected users.

Settle balance

Settle balance

Settle outstanding balances with a tap. Choose full amount or half.

Everything you need

Simple, fast, and built for everyday life.

Track expenses & income

Log every transaction by category. See at a glance how much you spend and earn each month.

Share expenses

Connect with others and split costs transparently. Everyone sees their share in real time.

Settle & track

Keep track of who owes what. Settle up with a tap and review your payment history.

Recurring transactions

Automate monthly expenses: rent, subscriptions, bills. Never forget anything again.

Monthly analytics

Dashboard with month-over-month and year-over-year comparisons. Spot trends and anomalies in your financial behavior.

Privacy first

No bank data stored. Your financial data is manually entered and protected. GDPR compliant.

Understanding the numbers that matter

Penno shows you simple but powerful metrics. Here's what they mean and why they matter for your finances.

Your summary

Net (Income - Expenses)
Your net balance for the period. Green means you saved money, red means you spent more than you earned.
MoM (month-over-month)
Percentage change compared to the previous month. Shows whether your spending, income, or savings went up or down.
YoY (year-over-year)
Change compared to the same month last year. Helps you spot seasonal patterns and long-term trends.
Color logic
For expenses: red means increase (bad), green means decrease (good). For income and net: green means increase (good), red means decrease (bad).

Your spending

% of total
How much each category contributes to your overall spending. Shows where most of your money goes at a glance.
MoM by category
Compares this month to the previous month. A sudden spike may signal an unusual expense worth reviewing.
YoY by category
Compares this month to the same month last year. Reveals seasonal patterns and long-term spending trends.

Your categories

This month
Net total for the current calendar month. Helps you track real-time spending against your habits.
Last month
Net total from the previous month. A quick reference to compare against your current pace.
vs last year
Percentage change compared to the same month one year ago. Reveals long-term trends and seasonal patterns.
Avg / month
Rolling 12-month average. Your baseline — if this month is far above it, you may be overspending.
Year to date
Cumulative net since January 1st. Tracks your annual trajectory for budgeting and tax planning.

Ready to take control?

Download Penno and start truly understanding your finances.